Monitoring
If you configured Observability, ProSA offers observability data out of the box.
Metrics
Metrics are useful in processors. To know more, refer to the processor you use to know which metrics they expose. They should export metrics.
But ProSA has also its own metrics to have a global view of what’s running. This generic dashboard will be available soon from Grafana if you want to import it.
Graphical representation
Having a view of every processor and service is important to know if your processors are healthy and if your services are up and running. There is a node graph to view the entire state of ProSA:
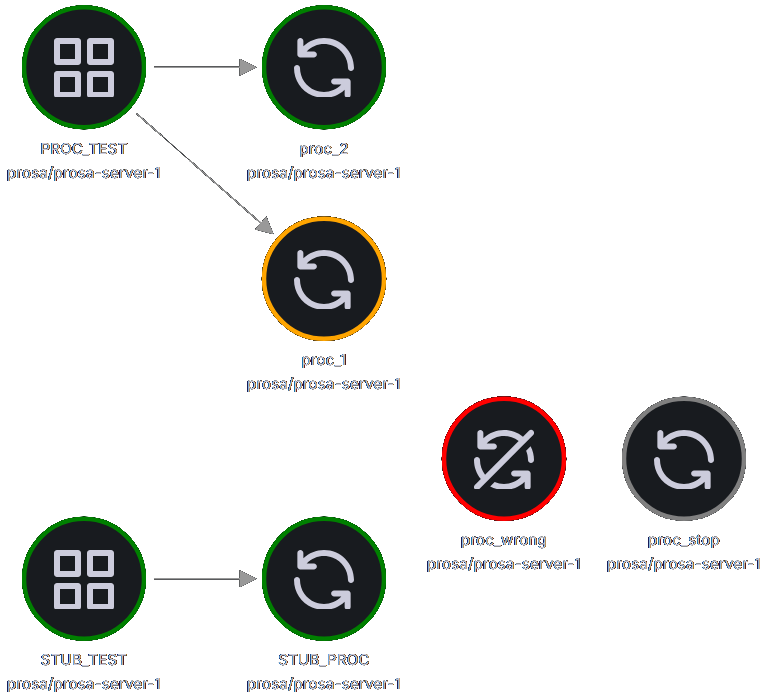
From this graph, you’ll see:
- Processors 🔄
- green indicates that they are running
- orange if they experienced at least one restart
- grey if they are stopped
- red if they crashed
- Services ⠶
- green if at least one processor exposes it
- grey if they are not available
- Links between processors and services representing processors that expose a service
From that graph, you have a complete view of your ProSA state.
System metrics
ProSA provides RAM metrics in order to keep track of process allocation. This could be useful to know if on a VM ProSA is using the RAM, or it’s another process on the host.
It provides 2 type of metrics:
virtualfor virtual RAM usedphysicalfor physical RAM used
To have system metrics, you need to enable the feature
system-metricsfor ProSA.
Traces
Since ProSA is a transactional framework, traces are a must-have to view transaction-relative information.
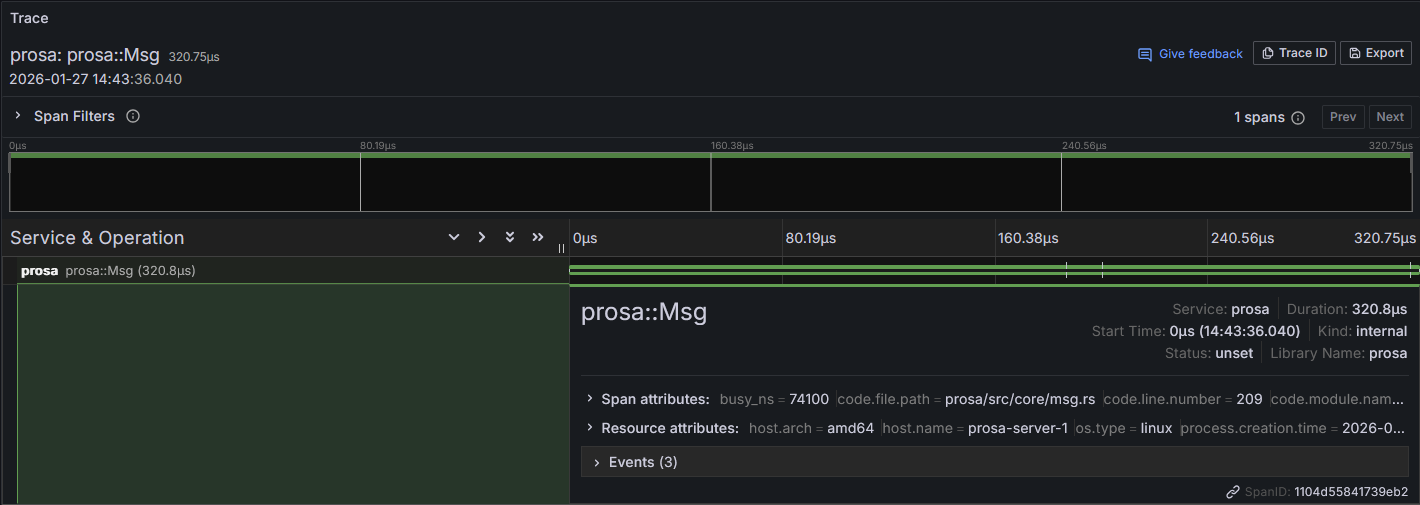
From this global trace, you can have processor spans attached to it.
Logs
All logs generated by ProSA are available. Normally processors should use the ProSA logging system. If they do not, please refer to your processor to know how to handle them.